How "Kuafu-1" Uncovered the Origin of the Extreme October 2024 Geomagnetic Storm
In October 2024, a major geomagnetic storm drove the Dst index down to –333 nT, making it the second most intense storm of Solar Cycle 25. Using key observations from the SCIWL coronagraph of Kuafu-1 or ASO-S, along with multi-viewpoint remote-sensing and in-situ data, Associate Researcher Rui WANG and colleagues at the State Key Laboratory of Solar Activity and Space Weather showed that the storm was driven by the sympathetic eruption of a filament and an active-region CME, followed by their interaction in interplanetary space.
An X1.8-class flare erupted from active region (AR) 13848 at 01:56 UT on 9 October 2024, triggering strong geomagnetic disturbances and the strongest solar energetic proton event of Solar Cycle 25, with a peak flux reaching 1150 pfu (http://www.sepc.ac.cn/). However, conventional automatic identification routines based on LASCO and STEREO-A data classified this event as a single full-halo CME—an interpretation inconsistent with in-situ signatures that clearly indicated CME–CME interaction. Determining the true structure of the source-region CMEs therefore became the key to understanding the storm's origin.
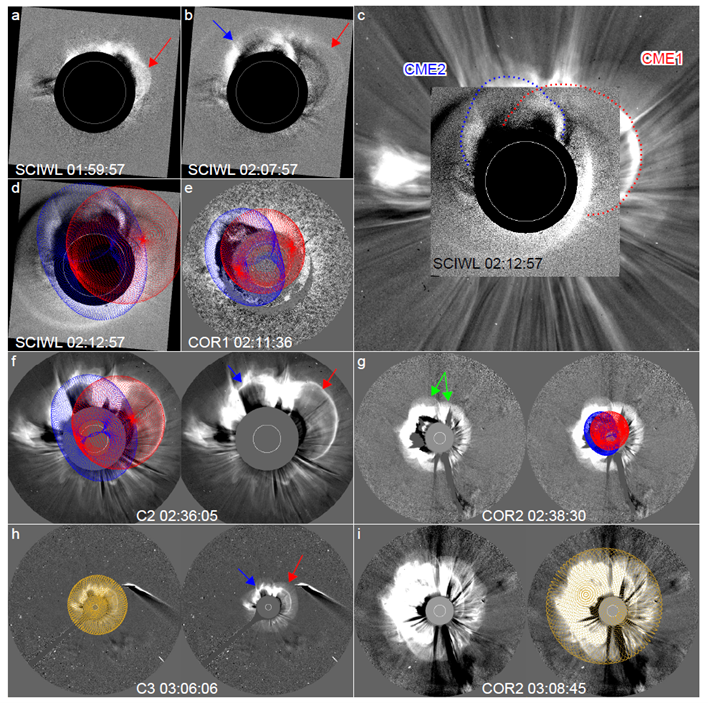
Figure 1. Multi-coronagraph observations and GCS model fitting. (a), (b) Two successive CME fronts observed by ASO-S/SCIWL; (c) composite view combining SCIWL and LASCO observations (red: filament spanning AR and quiet Sun; blue: AR CME); (h), (i) fitting results based on a spherical shock model.
Traditional LASCO coronagraphs cannot cover the very early stages of an eruption, while STEREO-A’s viewing geometry limited the ability to resolve the two CME structures. The SCIWL coronagraph covers a field of view from 1.1 to 2.5 solar radii, bridging the critical observational gap between extreme-ultraviolet imaging and conventional white-light coronagraphs. The analysis shows that two distinct CME fronts entered the SCIWL field of view (FOV) successively and were subsequently identified as the left and right wings of the “butterfly-shaped” CME seen in LASCO images (Figure 1), providing direct imaging evidence for a twin-CME structure. Using Full Sun Imager (FSI) observations from Solar Orbiter, the team further confirmed that a large-scale filament extending across the AR had already undergone reconnection and was slowly rising before the flare onset. Its spatial displacement relative to the expanding AR coronal loops indicated that the filament and the AR CME represented two separate eruptive structures.
The team applied the graduated cylindrical shell (GCS) model to fit the two CMEs independently. The results show the two CMEs nearly overlapping in the COR2 FOV. Because early-stage interaction can considerably alter the global morphology of CMEs, the researchers used a spheroid shock fitting method to reconstruct the common shock front of the two CMEs, estimating a linear shock speed of about 1730 km/s.
In terms of in-situ measurements, the angular separation of the Sun–Earth line between Wind and STEREO-A offered an opportunity for multi-point comparison. Both spacecraft recorded a pronounced enhancement in the magnetic field strength within the preceding CME (50 nT at Wind, 60 nT at STEREO-A), consistent with magnetic field compression in the interaction region (Figure 2). Wind measured a strong southward magnetic field component that directly drove the rapid drop in the Dst index, whereas STEREO-A, despite registering an even stronger total field, lacked a significant southward component, yielding an estimated Dst of only about –100 nT. This difference demonstrates that even moderate angular separations can introduce considerable uncertainty in assessing the geoeffectiveness of a CME.
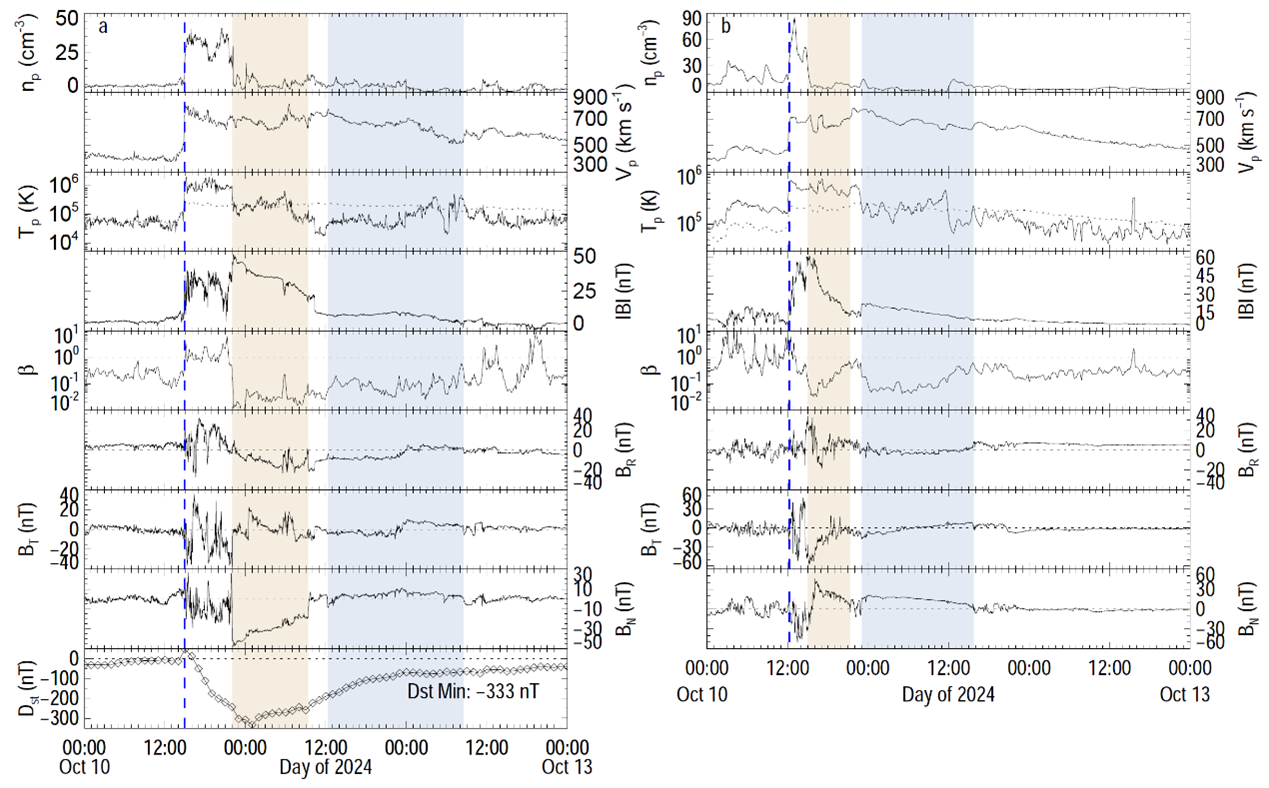
Figure 2. Left: in-situ measurements at Wind; right: in-situ measurements at STEREO-A. The yellow and blue shaded regions mark the intervals of the two CME, and the blue dashed lines indicate the shock front.
The chirality and magnetic axis orientation of the trailing CME at both spacecraft matched those of the AR CME in the source region, whereas the magnetic axis of the leading CME showed a substantial deviation from the filament orientation. This deviation may be related to kink instability of the filament in interplanetary space or to compression from the trailing CME. CORHEL-CME simulations further corroborate the complexity of magnetic connectivity following the interaction (Figure 3).
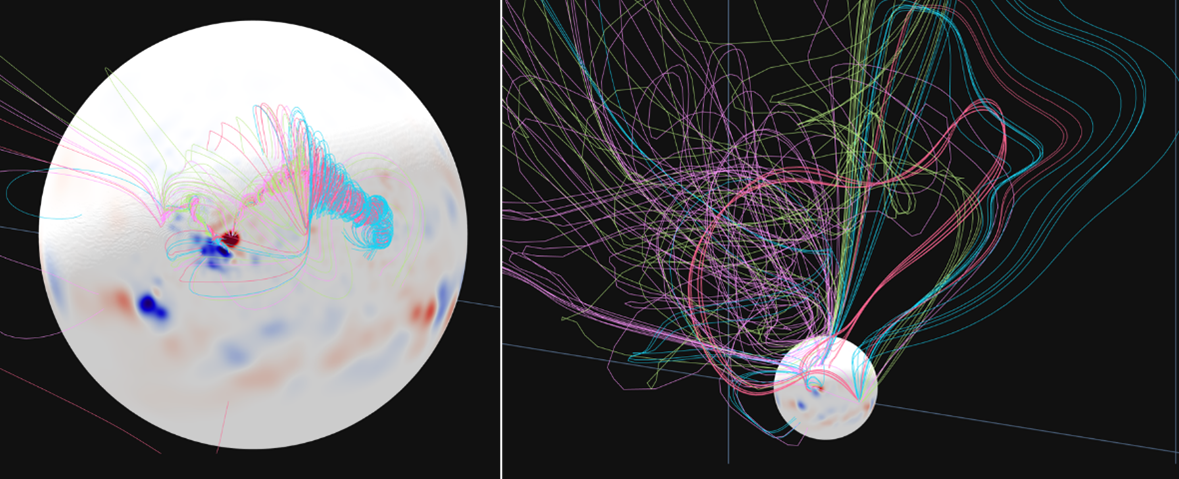
Figure 3. CORHEL-CME simulation results. Left: magnetic topology of the trans-active-region filament and the active-region magnetic flux rope at the early eruption stage. Right: complex magnetic field configuration and connectivity characteristics formed after the twin-CME eruption.
By integrating the critical inner-corona observations from Kuafu-1 with multi-viewpoint remote-sensing data and multi-point in-situ measurements, this study clarifies the twin-CME source structure and the interplanetary interaction process responsible for the extreme geomagnetic storm of October 2024. A key insight from this event is that overlooking eruption source details could lead to underestimating the complexity of CME activity, as only one halo CME was initially reported despite the two underlying interacting structures. Similarly, in-situ measurements at multiple points were essential to confirm the successful eruption of the slow-rising quiescent filament and to reveal the enhanced southward fields from compression during the interaction. These insights provide new observational constraints and theoretical guidance for improving the prediction capability for extreme space weather events.
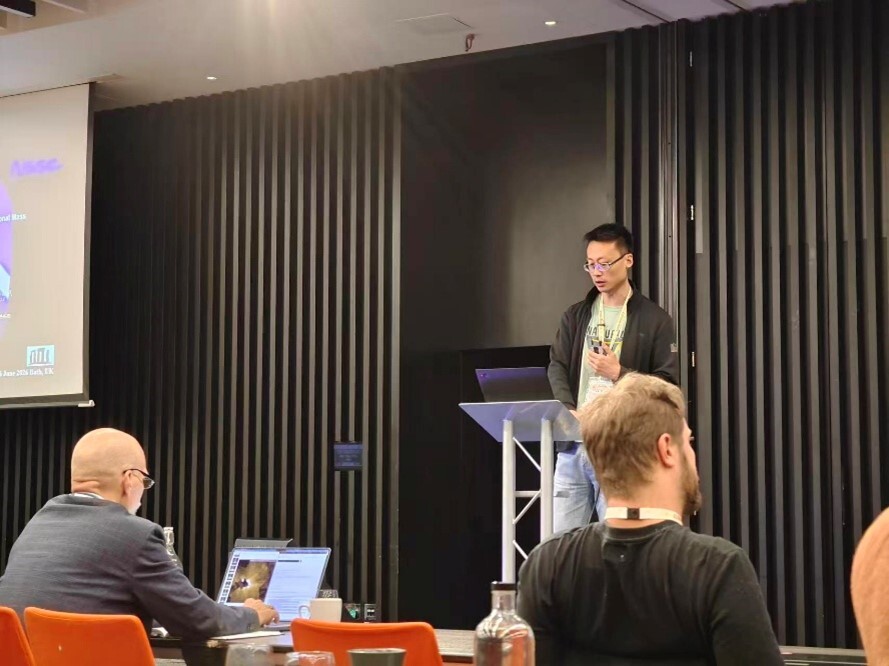
Figure 4. Team members presenting at the 17th International Solar Wind Conference.
The findings were presented at the 17th International Solar Wind Conference, where they drew considerable interest from the international community. Following the talk, Dr. Jon A. Linker, President of Predictive Science Incorporated, approached the team for in-depth discussions on the use of the CORHEL model, laying the groundwork for future collaboration. This research was supported by the Strategic Priority Research Program of the Chinese Academy of Sciences (XDB0560000), the National Key R&D Program of China (2021YFA0718600, 2022YFF0503800), the National Natural Science Foundation of China (12073032), the Space Exploration Origin Program, the Open Project of the Key Laboratory of Space Weather of the China Meteorological Administration, and the Special Fund of the National Key Laboratory of Solar Activity and Space Weather.
Paper link: https://iopscience.iop.org/article/10.3847/2041-8213/ae5801